

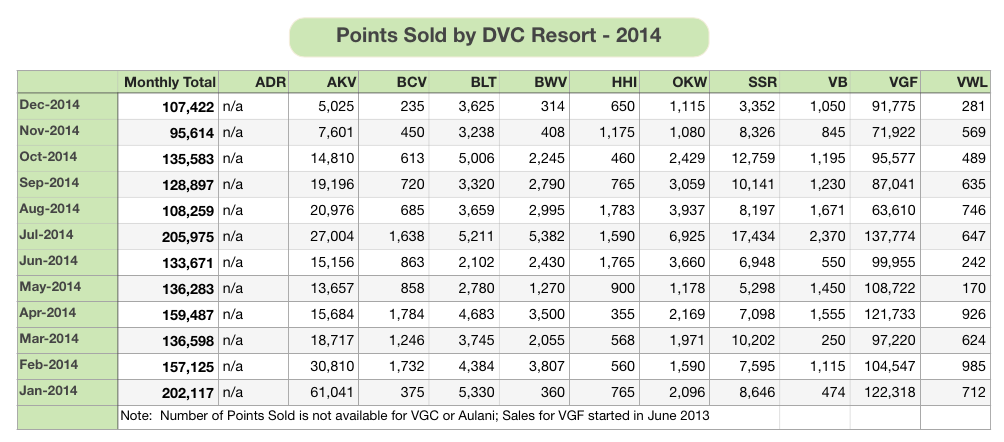
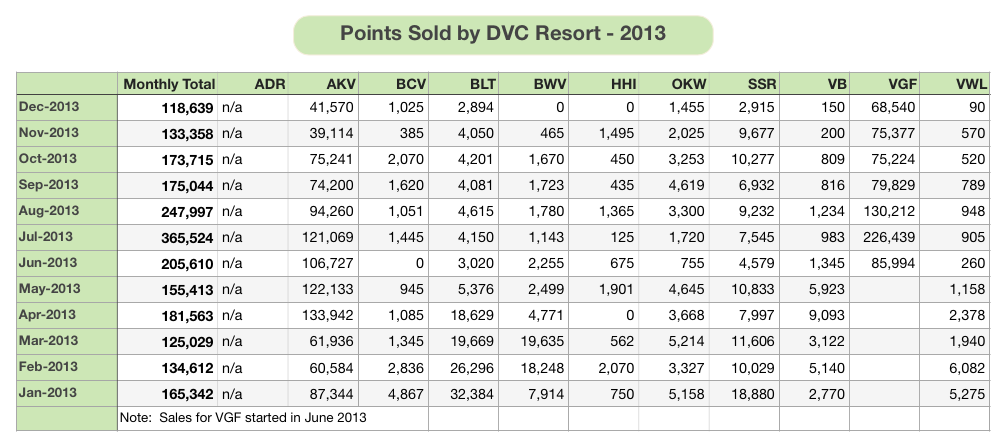
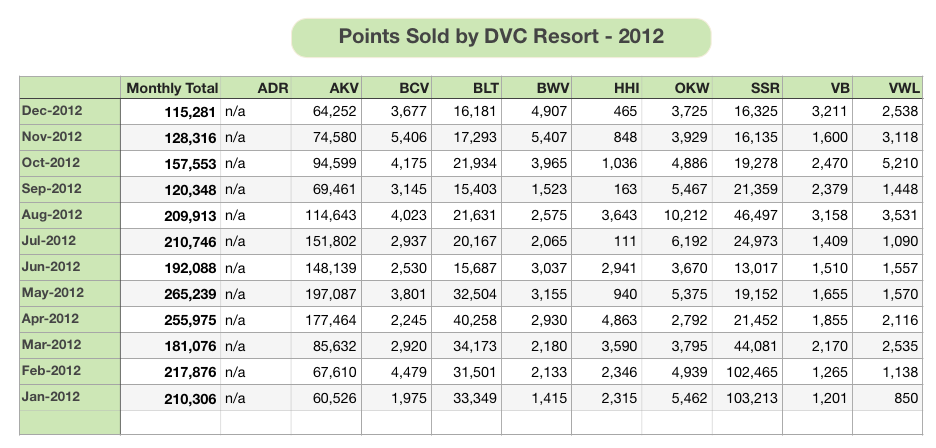
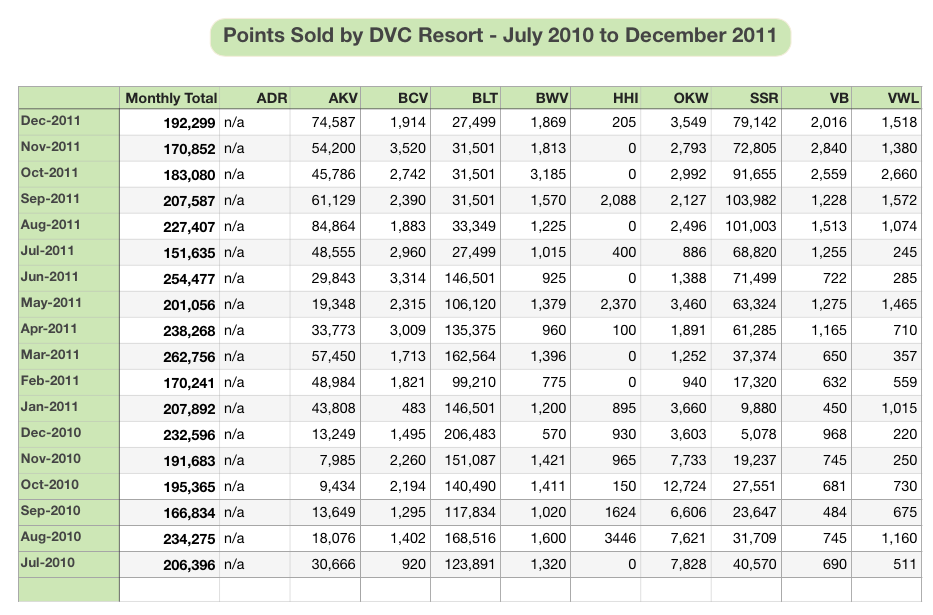
The charts below detail the total number of Disney Vacation Club contracts (deeds) and points sold, by month, from July 2010 to present. These numbers represent direct sales made by Disney Vacation Developement only. Resale transactions are not included.
(Last updated January 28, 2015)
Total Points Sold direct by DVC
{multithumb thumb_width=680 thumb_height=450 thumb_proportions=bestfit}
Total Deeds Sold direct by DVC
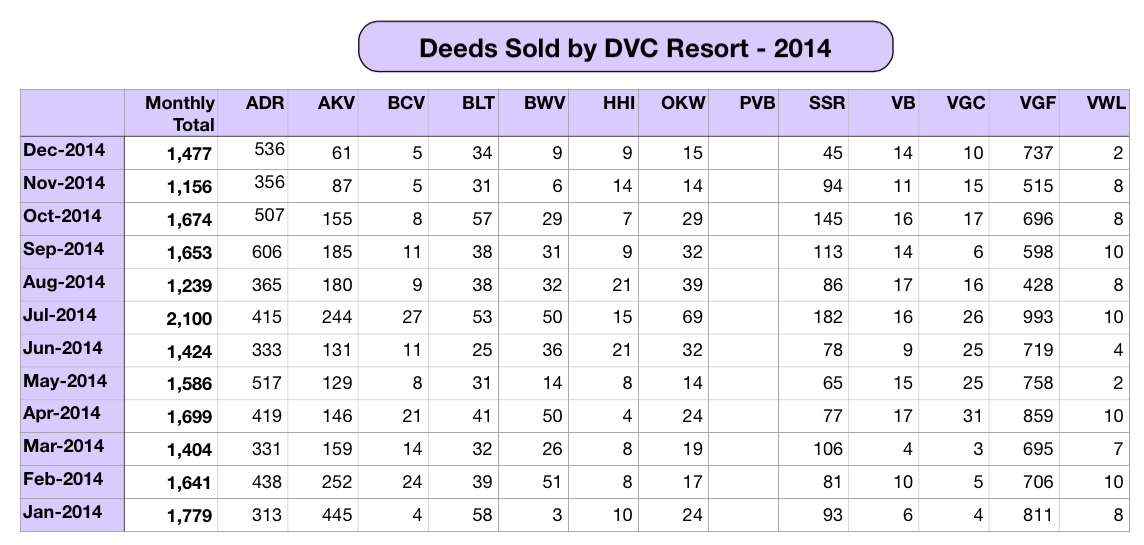
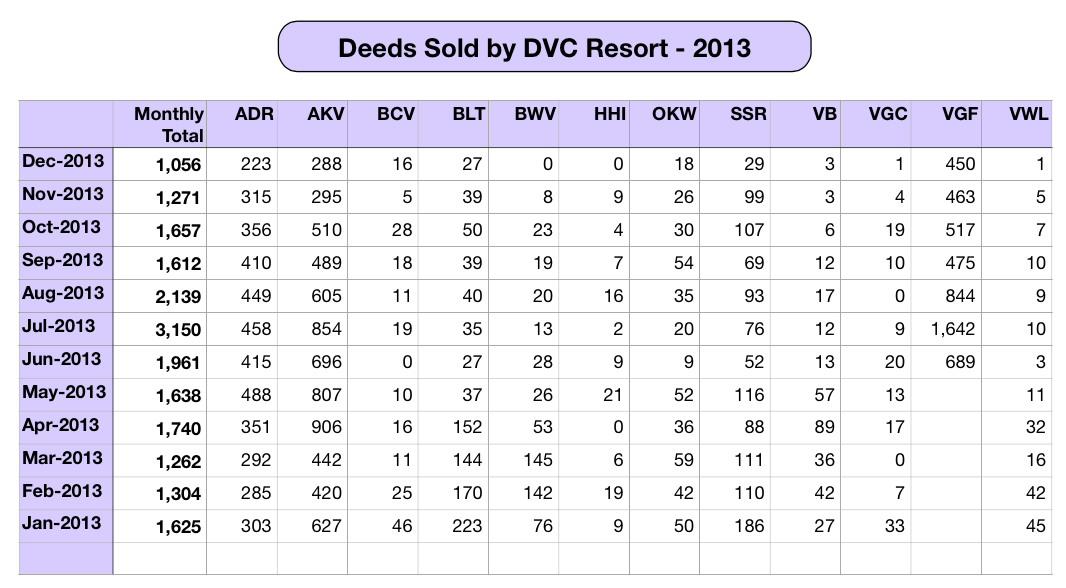
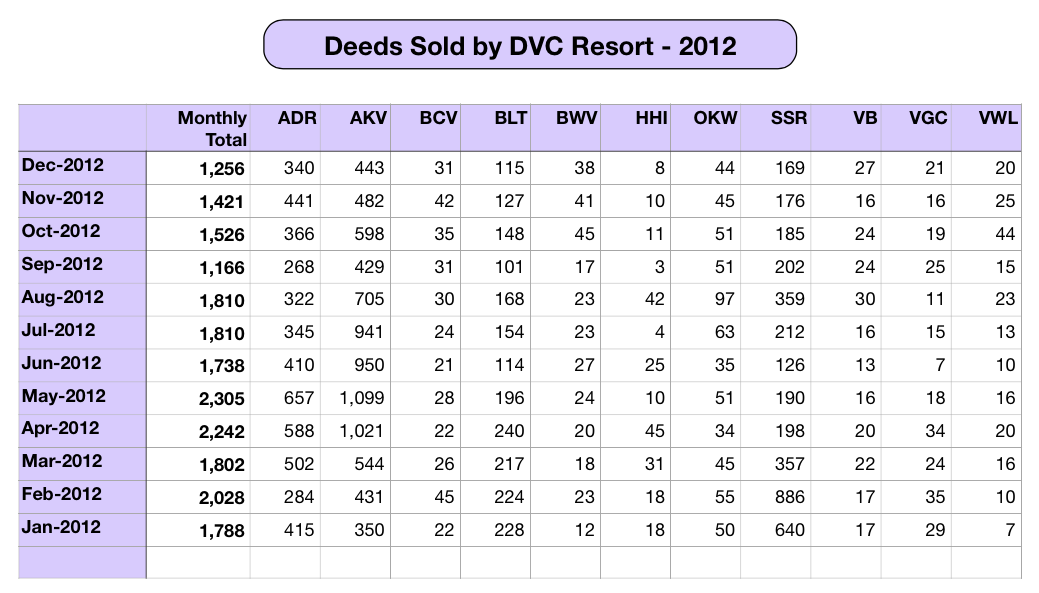
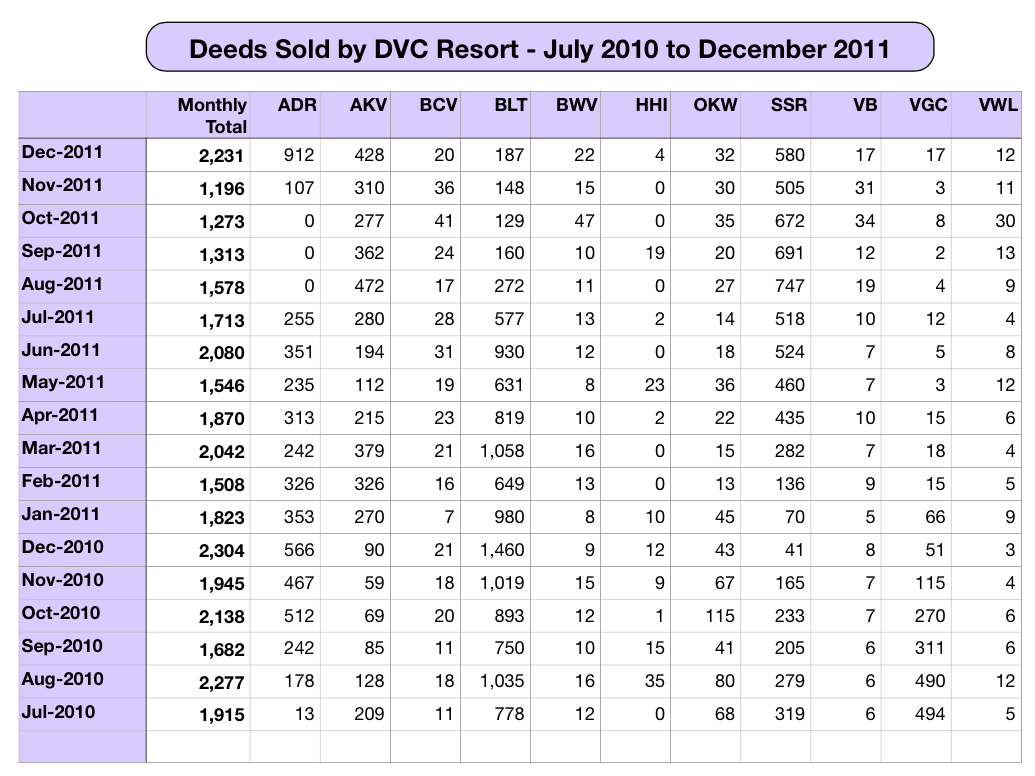
Thanks to Wil Lovato for assembling this data!
The chart below contains raw contract (deed) sales information for older periods not reflected in the figures above:
2006 2007 2008 2009 2010 January 1,446 1,784 1,788 2,222 1,633 February 1,488 2,040 1,922 1,933 1,428 March 1,761 2,792 2,260 1,893 1,781 April 1,934 2,644 1,885 1,649 1,570 May 2,035 1,774 1,732 1,343 1,836 June 1,946 2,490 2,158 2,500 1,797 July 1,600 2,101 2,312 2,354 1,915 August 1,949 2,184 1,401 1,917 2,277 September 1,649 1,718 2,819 1,968 1,682 October 1,287 1,767 2,265 1,879 2,138 November 1,453 1,409 2,590 1,414 1,945 December 1,326 1,498 1,648 1,256 2,304 Calendar Year 19,864 24,201 24,780 22,328 22,306 Notes for 2006 - 2010 chart:
- The month indicated is the month in which the deed has be recorded by the county. There may be a delay of 30 days or longer from the date of purchase to the recording of the deed
- Number of points purchased are not represented by these statistics
- These figures represent direct purchases only--there are no resale transactions included
- Figures included purchases at Walt Disney World-based resorts, Disney's Hilton Head Island resort, the Villas at Disney's Grand Californian Hotel and the Aulani resort in Hawai'i; VB is not included in most figures

03
Mon, Aug
